Engineering Analysis Module
Channel Maintenance Has Never Been Easier
Simplify decision-making by using the Engineering Analysis Module, the scalable and interoperable enterprise solution for infrastructure management based on CSAR datasets. Effectively manage navigation channels, waterways, and ports, including vertical walls, comparing to models and performing analysis.
Discover these and other tools, including profiles, differences, and linear referencing, all designed to provide the best engineering and analysis experience.
The Engineering Analysis Module can be licensed with the Bathy DataBASE suite or the standalone BASE Editor application.
Core Features
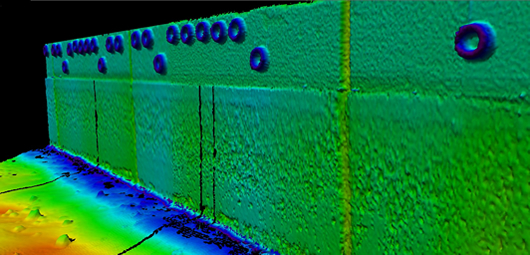
Vertical and inclined modelling and analysis
Customizable to vertical or sloped surfaces as coordinate referencing systems to create these raster surfaces to create a vertical or inclined surfaces.
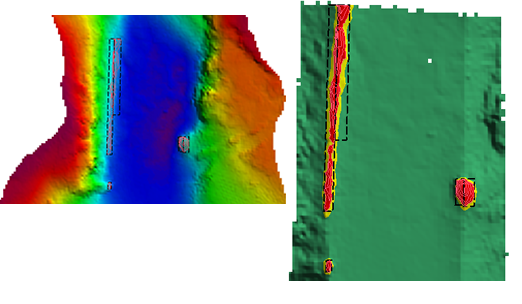
Shoal Management
Areas where bathymetry is above the model are marked, with additional areas created at every user-specified step above the model. These areas are covered by minimum bounding boxes, which can be automatically and manually merged to ensure the number of publications meets the project needs.
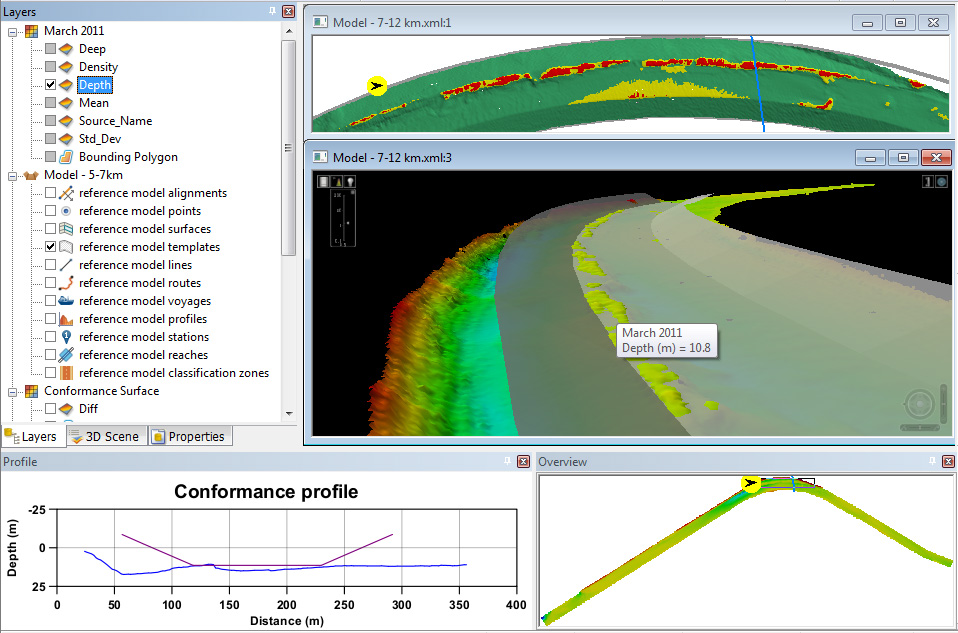
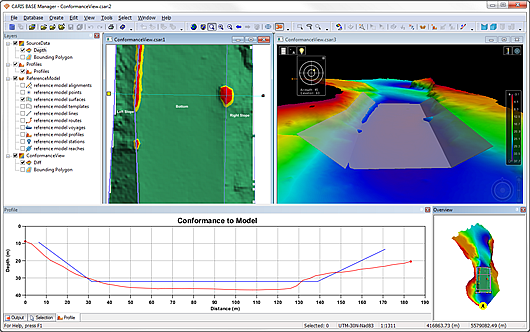
Conformance Analysis
Analyze the conformance of the depth by comparing the bathymetric data to a certain depth. Tools will color which area doesn't meet the depth requirement to allow for fast decision-making.
Volumes calculations
Calculating the amount of material above and below a model is a vital part of maintenance. Four types of computations are provided to suit varied needs. All of these calculations work with 3D models or at a fixed depth, with an optional allowance below the model.
Analysis of vertical model
Existing tools such as differencing raster surfaces or viewing profile can be applied over vertical or inclined reference surface.
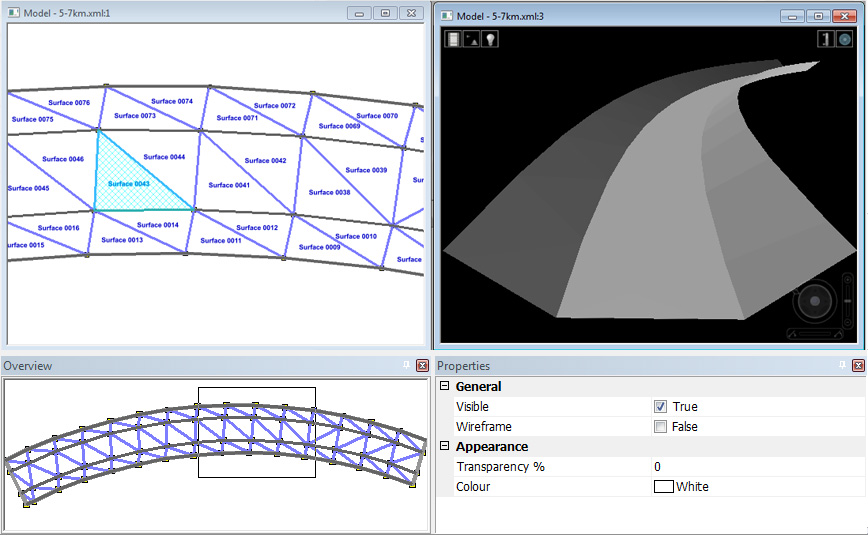
Model Editing
In addition to supporting the open LandXML specification, the Engineering Analysis Module provides tools to create a 3D model of the maintained area with the reference model editing functionality in BASE Editor.
Complementary Products
BASE Editor
Validate, analyze, and compile datasets in a variety of formats and from multiple new and historical sources.
HIPS and SIPS
Hydrographic processing solution that powers quality results and efficiency for single operators and the world's largest enterprises.
Learn moreTechnical Specifications
| Engineering Analysis Module | |
|---|---|
| Component | Recommended |
| Processor | Intel® 3.0 GHz Processor or better |
| Memory | 2 GB of RAM |
| Storage | 1 GB of available space for installation |
| Display | OpenGL 3.3 compatible display adapter supporting 1,024 x 768 display resolution with true color |
| Operating System | Windows® 10 Professional 64-bit |
|
The latest version of the software requires a video card that fully supports OpenGL with a recommended 512MB of RAM, we advise against the use of onboard video cards as some functionality issues have been observed. |
|